Milton Coste

Licensed Real Estate Associate Broker

(917) 416-7433
NYC 5 Borough Price Tracking 2026: Manhattan Brooklyn Queens Bronx Staten Island
Market Analysis

NYC Real Estate Prices by Borough 2026: Live Data All 5

Median sales prices, days on market, and inventory trends tracked across Manhattan, Brooklyn, Queens, the Bronx, and Staten Island

Milton Coste, Licensed Real Estate Associate Broker Keller Williams NYC NY Lic. #10301213304
July 21, 2026 10 min read 25+ Years Experience

All five NYC boroughs posted year-over-year price gains in June 2026: Brooklyn led at +10.3% to a $1.07M median, Manhattan rose 6.5% to $1.23M, and the citywide median sales price hit $900K, up 5.9%. Queens added 1.1% to $715K, the Bronx rose 2.6% to $585K, and Staten Island edged up 1.4% to $730K. I've been selling NYC real estate since 4-line ads in the Daily News, and I pull these StreetEasy numbers every month because borough medians only tell half the story. The neighborhood tables below are where the real information lives.

This page tracks NYC real estate prices by borough: median sales price, year-over-year change, days on market, and the median asking rent for a 1-bedroom, all from StreetEasy Market Reports as of June 2026. Bookmark it; the tables get refreshed as new monthly data lands.

Area Median Sale Price YoY Change Days on Market Median 1BR Rent
Manhattan $1.23M ↑6.5% 64 $4,807
Brooklyn $1.07M ↑10.3% 52 $3,600
Queens $715K ↑1.1% 55 $3,000
Bronx $585K ↑2.6% 79 $2,800
Staten Island $730K ↑1.4% 37 $3,250
NYC (citywide) $900K ↑5.9% 58 $3,995

Source: StreetEasy Market Reports · Data: June 2026

Related NYC Data Trackers

This tracker is part of a set. The companion pieces go deeper on three questions this page raises:

Manhattan: $1.23M Median, Volume Concentrated Uptown

Manhattan's median sales price reached $1.23M in June 2026, up 6.5% from a year earlier. Listings took a median 64 days to sell, and the median asking rent for a 1-bedroom hit $4,807, the highest of the five boroughs. The volume story sits uptown: the Upper East Side and Upper West Side recorded 2,657 and 2,257 sales over the trailing 12 months, the two most active neighborhoods in this data, anchored by deep pre-war co-op stock along the Q on Second Avenue and the 1/2/3 on Broadway.

Five Highest-Volume Manhattan Neighborhoods

Neighborhood Recorded Sales (12 mo) Median Price (Jun 2026) YoY Days on Market
Upper East Side 2,657 $1.40M ↑9.8% 60
Upper West Side 2,257 $1.33M ↑7.2% 55
Midtown East 1,536 $875K ↓12.4% 79
Chelsea 609 $1.39M ↑33.8% 64
Greenwich Village 486 $1.98M ↑33.9% 52

Source: StreetEasy Market Reports · Data: June 2026

How to Read a Neighborhood Median

A neighborhood median is the median of what sold that month, not a like-for-like price change on the same apartments. When Chelsea prints +33.8% or Greenwich Village +33.9%, the swing mostly reflects which units happened to close: unit mix, new development closings, a handful of large deals in a small sample. Treat big swings as a description of that month's sales, not proof of appreciation.

One more note on the sales counts: they cover recorded deeds from July 2025 through June 2026 and are used here to rank neighborhoods by activity. Deed recording lags closings, so recent months undercount. Don't read them as complete annual totals.

Brooklyn: +10.3%, the Steepest Borough Gain

Brooklyn posted the steepest borough-level gain in June 2026: a $1.07M median, up 10.3% year over year, with a median 52 days on market and a $3,600 median asking rent for a 1-bedroom. Bedford-Stuyvesant led the borough in activity with 656 recorded sales over the trailing 12 months, and its 38 days on market is among the fastest in this table. Williamsburg's +59.8% and Park Slope's +41.9% are the mix effect at work: those medians describe the units that closed, not a sudden repricing of the whole neighborhood. Sheepshead Bay cuts the other way, down 20.1% on the same logic.

Bed-Stuy Leads Brooklyn Activity

Neighborhood Recorded Sales (12 mo) Median Price (Jun 2026) YoY Days on Market
Bedford-Stuyvesant 656 $1.46M ↑7.9% 38
Williamsburg 646 $1.95M ↑59.8% 57
Sheepshead Bay 610 $611K ↓20.1% 66
Park Slope 529 $2.20M ↑41.9% 32
East New York 478 $659K ↓5.8% 46

Source: StreetEasy Market Reports · Data: June 2026

The property stock explains part of the spread. Bedford-Stuyvesant and Park Slope are brownstone Brooklyn, rowhouse blocks with landmarked stretches. Williamsburg's condo inventory runs along the L train and the East River ferry. Sheepshead Bay, on the B and Q lines, brings lower entry prices near the water, and East New York remains one of the lowest-cost points of entry in the borough's sales data.

Which Borough Fits Your Budget?

Milton Coste represents buyers and sellers across all five boroughs and Hudson Valley. Get a read on where your budget actually lands, neighborhood by neighborhood.

Schedule a Buyer Consultation

Queens: The Steadiest Line at $715K

Queens is the steadiest line in this month's tracker: a $715K median, up 1.1% year over year, the smallest move of the five boroughs, with 55 days on market and a $3,000 median 1-bedroom asking rent. When you compare NYC real estate prices by borough, Queens keeps offering the widest range under the citywide $900K median. Flushing was the most active neighborhood in the entire borough with 1,246 recorded sales in 12 months, even as its median slipped 12.7% to $550K. Astoria's +43.1% and Jackson Heights' +30.3% carry the same mix caveat as the big Brooklyn swings; read our full Astoria waterfront guide for what's being built along the N and W.

Flushing: Most Active in the Borough

Neighborhood Recorded Sales (12 mo) Median Price (Jun 2026) YoY Days on Market
Flushing 1,246 $550K ↓12.7% 61
Forest Hills 741 $365K ↓15.1% 59
Astoria 547 $1.09M ↑43.1% 55
Bayside 491 $550K ↓34.1% 34
Jackson Heights 467 $580K ↑30.3% 47

Source: StreetEasy Market Reports · Data: June 2026

Two reading notes on this table. Forest Hills' $365K median and Flushing's $550K sit well below the borough-wide $715K; that gap is the mix effect again, driven by which units closed, and it cuts in both directions. And Bayside's 34.1% drop paired with a fast 34 days on market says what sold moved quickly, it just skewed lower-priced. Along the 7 train, Sunnyside gets its own median price and commute breakdown.

REBNY RLS

Active Listings: All Five Boroughs

Current listings matching the price points tracked in this report

View All

Listing information provided courtesy of the Real Estate Board of New York's Residential Listing Service (RLS). Information is deemed reliable but not guaranteed. Sale listings verified. ©2026 REBNY. RLS data displayed by Keller Williams NYC.

The Bronx: Big Swings, Small Samples

The Bronx median rose 2.6% to $585K in June 2026, and its 79 days on market is the longest of the five boroughs. This is also where the sample-size warning matters most. Parkchester printed +74.0%, but that's a jump from a $200K median in June 2025 to $348K in June 2026 on just 239 recorded sales in twelve months: the median of what sold, not a neighborhood doubling in value. Riverdale, the borough's most active neighborhood in this data with 428 recorded sales, posted a steadier +10.1% to $402K, with Metro-North service to Grand Central. StreetEasy publishes June 2026 days on market for 140 of its 176 tracked neighborhoods; our days on market tracker sorts every one of them.

Throgs Neck: 30 Days on Market

Neighborhood Recorded Sales (12 mo) Median Price (Jun 2026) YoY Days on Market
Riverdale 428 $402K ↑10.1% 59
Parkchester 239 $348K ↑74.0% 97
Throgs Neck 205 $715K ↓1.0% 30
Soundview 180 $665K ↓7.6% 92
Wakefield 133 $455K ↓3.2% n/a

Source: StreetEasy Market Reports · Data: June 2026. Wakefield days on market is not available in the source data.

Throgs Neck is worth a second look in this table: a $715K median, in line with the borough-wide Queens figure, and just 30 days on market, the fastest of any neighborhood on this page. Priced-right inventory there is not sitting.

Staten Island: Fastest Market at 37 Days

One note before the numbers: StreetEasy does not publish neighborhood-level data for Staten Island, so this section tracks the borough as a whole. In plain terms, the table below covers all of Staten Island, and a neighborhood-by-neighborhood breakdown isn't possible from this source.

The borough-level story is the fastest market in the city. Staten Island's median 37 days on market in June 2026, down from 40 a year earlier, beats every other borough, on a $730K median sales price that rose 1.4%. Two details are worth watching together: for-sale inventory shrank to 263 listings from 305, while the share of listings taking a price cut rose to 12.2% from 10.2%. Tight supply and more price cuts can coexist; our price cuts and discount tracker follows that second number across the city. The sale-to-list ratio held at 97.1%, nearly unchanged from 97.2%, and the housing stock itself, heavy on detached and semi-detached houses served by the ferry and the Staten Island Railway, keeps the borough a different kind of purchase than the other four.

Borough Metrics, June 2026 vs June 2025

Metric June 2026 June 2025
Median sales price $730K $720K
Days on market 37 40
Price-cut share 12.2% 10.2%
Sale-to-list ratio 97.1% 97.2%
For-sale inventory 263 305

Source: StreetEasy Market Reports · Data: June 2026

Conclusion: How to Use This Tracker

Every borough moved up in June 2026, but the spread is the story: Brooklyn's +10.3% and Manhattan's +6.5% did the citywide lifting while Queens, Staten Island, and the Bronx moved between 1.1% and 2.6%. If you follow NYC real estate prices by borough to time a purchase or a sale, work from the neighborhood tables, not the headline medians, and remember the mix rule from the callout above: one month's median describes one month's closings. For the longer view, our companion piece on neighborhood price resilience from 2010 to 2026 shows which markets held value across the full data record. This series starts in January 2010, so nothing here speaks to earlier cycles.

For more personalized insight, visit miltoncoste.com or call me at (917) 416-7433. I'm happy to walk through what these numbers mean for your specific search.

Ready to Put the June Data to Work?

Talk through what these borough numbers mean for your search, your budget, and your timing with a broker who tracks them monthly.

Schedule a Free Consultation

Author Bio:

Milton Coste is a Licensed Real Estate Associate Broker with Keller Williams NYC, working in English and Spanish across all five boroughs and Hudson Valley. Some of the deals he has closed, 1,100+ tracked transactions, are at miltoncoste.com/listings.


Active Listings

Active Listings in Manhattan

Listings sourced live from REBNY RLS and OneKey MLS. All listings verified active at time of viewing. Updated daily.

View Active Listings Get Custom Search

This information is not verified for authenticity or accuracy and is not guaranteed. ©2026 The Real Estate Board of New York, Inc. All rights reserved. Listing data sourced from REBNY RLS and OneKey MLS. Listing Courtesy of Keller Williams NYC.


Milton Coste

Milton Coste

Licensed Real Estate Associate Broker · Keller Williams NYC

License No. 10301213304 · 360 Madison Avenue, 9th Floor, NY 10017

Equal Housing Opportunity

Equal Housing Opportunity. We are pledged to the letter and spirit of U.S. policy for the achievement of equal housing opportunity throughout the Nation. Milton Coste and Keller Williams NYC are committed to full compliance with the Federal Fair Housing Act (42 U.S.C. §§ 3601-3619), the New York State Human Rights Law (Executive Law, Article 15), and the New York City Human Rights Law (Title 8, NYC Administrative Code).

MLS & Listing Data Disclaimer: This information is not verified for authenticity or accuracy and is not guaranteed and may not reflect all real estate activity in the market. ©2026 The Real Estate Board of New York, Inc. All rights reserved. Listing information is provided solely for consumers' personal, non-commercial use and may not be used for any purpose other than to identify prospective properties consumers may be interested in purchasing. Listing data sourced from REBNY RLS and OneKey MLS. Listing Courtesy of Keller Williams NYC.

Financial & Market Data Disclaimer: All financial figures, market statistics, price estimates, and rental rates are sourced from StreetEasy Market Reports and provided for informational purposes only. Market conditions change frequently. This content does not constitute financial, tax, investment, or legal advice. Consult a licensed financial advisor, CPA, or attorney before making financial decisions. Published in accordance with 19 NYCRR Part 175 (NY DOS Real Estate Broker Advertising Regulations). Milton Coste operates as a Licensed Real Estate Associate Broker under the supervision of Keller Williams NYC.

Content published: July 2026 · Milton Coste · Keller Williams NYC · License No. 10301213304

REBNY RLS

More Active Listings: All Five Boroughs

Current listings matching the price points tracked in this report

View All

Listing information provided courtesy of the Real Estate Board of New York's Residential Listing Service (RLS). Information is deemed reliable but not guaranteed. Sale listings verified. ©2026 REBNY. RLS data displayed by Keller Williams NYC.

Get NYC market insights delivered to your inbox

New listings, market data, and expert analysis. No spam.

We respect your privacy. Unsubscribe at any time.

Share this article:

Related Articles

Milton Coste, NYC Real Estate Broker

Milton Coste

Licensed Real Estate Associate Broker

Keller Williams NYC · Lic. #10301213304

Milton's listings and commentary have appeared in The New York Times, the New York Post, and Haven Lifestyles. See the coverage.

Have questions about this topic?

Let's talk. I typically respond within a few hours.

Disclaimer: All information provided in this article is for educational purposes only and does not constitute legal, financial, or real estate advice. Listing data sourced from the REBNY Residential Listing Service (RLS). Information is deemed reliable but not guaranteed. Milton Coste is a Licensed Real Estate Associate Broker affiliated with Keller Williams NYC, 360 Madison Avenue, 9th Floor, New York, NY 10017. License No. 10301213304. Equal Housing Opportunity. This advertisement complies with New York State Department of State regulations governing real estate advertising. © 2026 Milton Coste. All rights reserved.

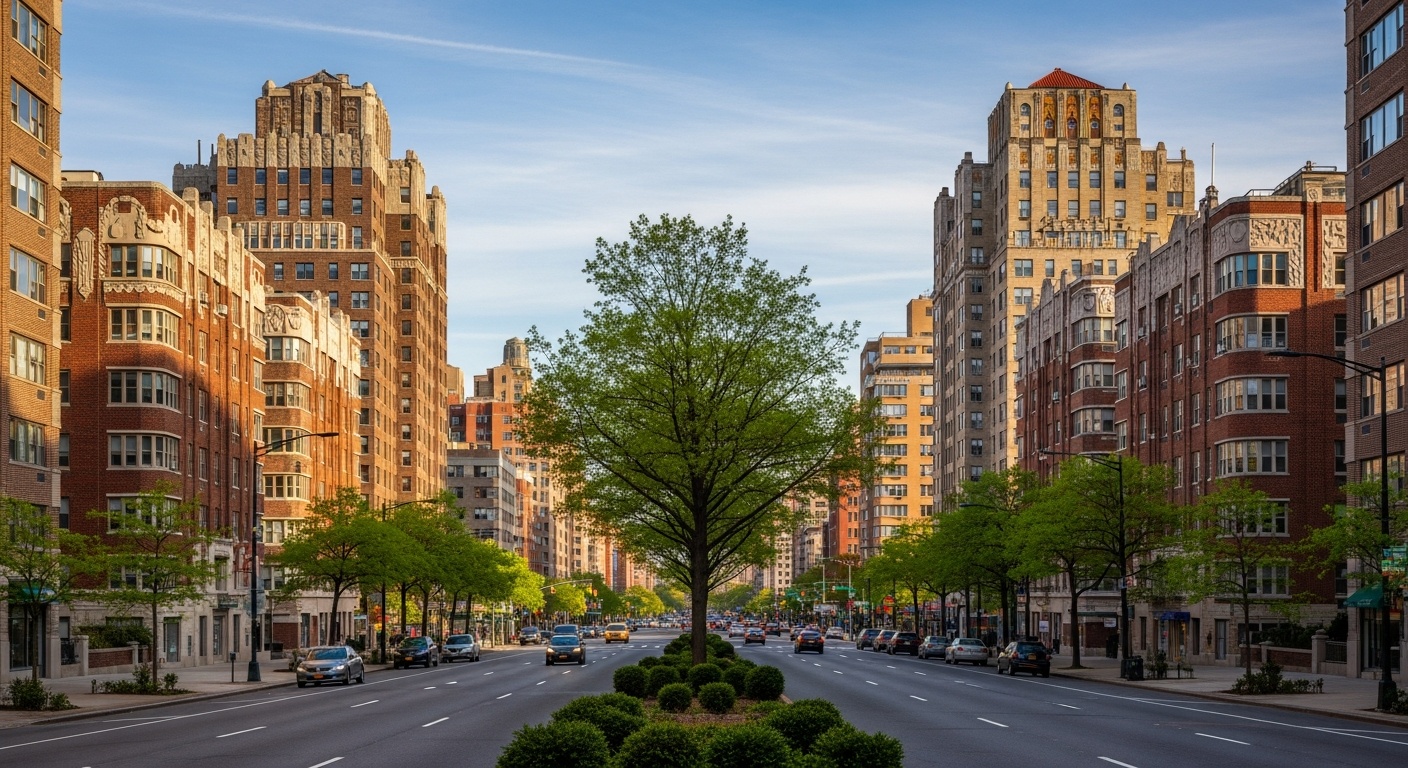
Image Disclosure: Header images on this blog are AI-generated editorial illustrations and do not depict specific properties for sale or rent.

Milton Coste

Milton Coste

Licensed Real Estate Associate Broker · Keller Williams NYC

License No. 10301213304 · 360 Madison Avenue, 9th Floor, New York, NY 10017

(917) 416-7433 [email protected] miltoncoste.com
Call Text Valuation