3Q 2026
Brooklyn
$1,160,500
Median sale price
Download the report
Manhattan
$1,275,000
Median sale price
Download the report
Queens
$775,000
Median sale price
Download the report
2Q 2026
Bronx
$400,000
Median sale price
Download the report
Dutchess County
$520,000
Median sale price
Download the report
Orange County
$462,450
Median sale price
Download the report
Putnam County
$576,000
Median sale price
Download the report
Rockland County
$749,000
Median sale price
Download the report
Sullivan County
$335,000
Median sale price
Download the report
Ulster County
$450,000
Median sale price
Download the report
Westchester County
$805,000
Median sale price
Download the report
Citywide
NYC quarterly market book, 2026 Q2
Every borough and neighborhood in one book, read it online, no form needed
Every area, side by side
The latest median sale price for each area and its change from the same quarter a year earlier. Sources differ by area; each report explains its own.
| Area | Period | Median price | Vs. a year earlier | Source |
|---|---|---|---|---|
| Brooklyn | from July through September 2026 | $1,160,500 | −1.0% | REBNY Listing Service data |
| Manhattan | from July through September 2026 | $1,275,000 | +10.9% | UrbanDigs data |
| Queens | from July through September 2026 | $775,000 | +14.1% | REBNY Listing Service data |
| Bronx | from April through June 2026 | $400,000 | +9.3% | HGAR / OneKey MLS data |
| Dutchess County | from April through June 2026 | $520,000 | +13.0% | HGAR / OneKey MLS data |
| Orange County | from April through June 2026 | $462,450 | +6.0% | HGAR / OneKey MLS data |
| Putnam County | from April through June 2026 | $576,000 | −1.5% | HGAR / OneKey MLS data |
| Rockland County | from April through June 2026 | $749,000 | +8.1% | HGAR / OneKey MLS data |
| Sullivan County | from April through June 2026 | $335,000 | −6.9% | HGAR / OneKey MLS data |
| Ulster County | from April through June 2026 | $450,000 | +3.4% | HGAR / OneKey MLS data |
| Westchester County | from April through June 2026 | $805,000 | +3.2% | HGAR / OneKey MLS data |
How are these reports made?
Manhattan uses the quarterly UrbanDigs report Keller Williams NYC distributes. Brooklyn and Queens use closed sales from the REBNY Listing Service, measured the way UrbanDigs measures Manhattan: median price, days to contract and sale price against the original asking price. The Bronx and the Hudson Valley counties use figures the Hudson Gateway Association of REALTORS® publishes from OneKey® MLS; the Bronx also adds every sale recorded with the city.
Why are some numbers missing?
A figure built on a handful of sales can mislead. When a home type or neighborhood had fewer than 10 sales in the quarter, the report leaves it out.
Who prepares these reports?
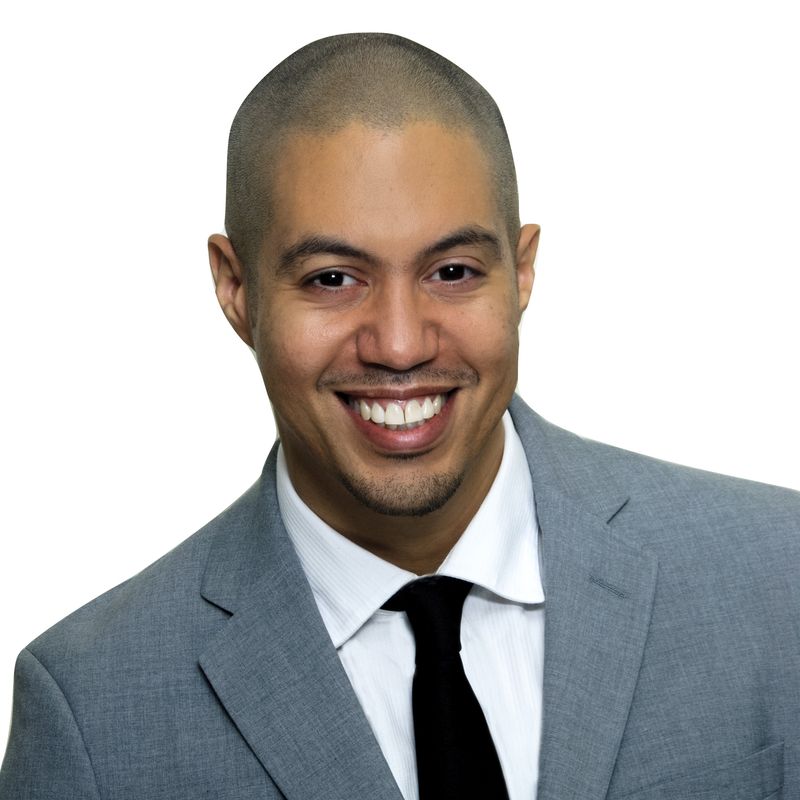
Milton Coste, Licensed Real Estate Associate Broker at Keller Williams NYC, who works across all five boroughs and the Hudson Valley in English and Spanish.
Milton Coste | Licensed Real Estate Associate Broker | Keller Williams NYC | License #10301213304 | 360 Madison Avenue, 9th Floor, New York, NY 10017