Sunnyside leads this list with a 12.0% rise in median sale price over the last twelve months, ahead of Long Island City at 10.4% and Prospect Lefferts Gardens at 9.3%. Four of the fifteen went the other way. Bay Ridge is down 10.0%, Hamilton Heights down 9.4%, Jackson Heights down 7.3%, and Washington Heights down 1.5%. That split is the story of this refresh: the spring version of this list showed every neighborhood appreciating, and a full second quarter of data says that is no longer true. As a Licensed Real Estate Associate Broker at Keller Williams NYC working across all five boroughs, I would rather publish a list with four negatives on it than carry April's numbers into August and let a buyer price off them.
Every figure below comes from two sources and nothing else. The 12-month price change and the days-on-market column come from StreetEasy monthly historicals, comparing the trailing twelve months against the twelve before them so a single low-volume month cannot swing a neighborhood ten places. The median price per square foot is a live RLS pull of closed sales over the 180 days ending August 11, 2026, with the number of closed sales in each sample shown so you can see which neighborhoods have thin data and which do not.
All 15 NYC Neighborhoods, Ranked by 12-Month Price Growth
Price change and days on market: StreetEasy monthly historicals, trailing twelve months ending June 2026 versus the twelve months before. Median $/sqft: RLS closed sales over the 180 days ending August 11, 2026. Ranks 14 and 15 are held in position from the April edition because their samples are too small to rank honestly.
Why This List Changed Since Spring
The April edition of this ranking put Washington Heights at number one and showed all fifteen neighborhoods appreciating. Neither holds up against the second quarter of data. Washington Heights now sits at number ten with a 1.5% decline, and four neighborhoods are negative over twelve months.
Three moves are worth understanding rather than just noting.
Sunnyside and Woodside separated. In April these two were treated as a pair, the affordable bookends of the 7 line. Over the last twelve months Sunnyside's median sale price rose 12.0% while Woodside's rose 1.0%. The $/sqft gap tells the same story from the other side: Sunnyside closed at $795 against Woodside's $595. Two stops apart on the same line, and no longer the same trade.
Bay Ridge reversed. It was the slowest riser on the April list at the bottom of the pack, and it is now the steepest decline at 10.0% down with days on market up to 87. Brooklyn's headline numbers are still strong, which is exactly why a borough-level figure is a poor substitute for a neighborhood one.
Long Island City's price per square foot came in far above the April figure. The April list showed $1,180. The live RLS pull across 95 closed sales puts it at $1,626. A sample of 95 in a single neighborhood is about as solid as this data gets in New York, so the earlier number was the one that was off.
Read the Sample Size Column First
Riverdale ranks fifth on price growth, but its $/sqft comes from two closed sales that reported square footage in six months. Woodside's comes from five. In a neighborhood that closes a handful of recorded sales a quarter, one unusual apartment moves the median more than the market does. Bed-Stuy at 96 sales, Long Island City at 95, and Prospect Lefferts Gardens at 38 are the figures on this page you can actually price against.
Manhattan: Three Neighborhoods, Three Different Directions
Inwood is the only Manhattan neighborhood on this list still appreciating, up 5.4% with a median closed price per square foot of $518. It is also the slowest mover here at 132 days, the longest average on the page, so a buyer has room to work and a seller needs patience. Pre-war co-ops near the 207th Street station remain the lowest entry point in the borough.
Washington Heights is down 1.5% at $638 per square foot, with days on market improving to 85 from 111 the year before. Prices flat and inventory moving faster is a market finding its level, not a market falling apart. The A express reaches Midtown in about 25 minutes.
Hamilton Heights is the steepest Manhattan decline at 9.4% down, with $741 per square foot across 14 closed sales. Limestone rowhouses and express 1 train service define the housing stock. The sample is thin enough that one more quarter should be read before treating the decline as a trend.

Active Listings Across All Boroughs
New listings from the top-ranked neighborhoods
View All
Listing information provided courtesy of the Real Estate Board of New York's Residential Listing Service (RLS).
Information is deemed reliable but not guaranteed. Sale listings verified.
©2026 REBNY. RLS data displayed by Keller Williams NYC.
Queens: Five of the Top Nine
Queens places five neighborhoods in the top nine, more than any other borough. Sunnyside leads the whole list at 12.0%, though on a sample of eight closed sales. Long Island City is the strongest combination of growth and data depth anywhere on this page: 10.4% growth, $1,626 per square foot, 95 closed sales, 65 days on market. Its waterfront condo inventory is what pulls the price per square foot so far above the rest of the borough, and my Long Island City guide covers the building stock in depth.
Forest Hills sits fourth at 7.6% growth and $811 per square foot, with 67 days on market and 33 closed sales, a combination of momentum and sample depth that few neighborhoods on this list match. Astoria is seventh at 4.9% and the fastest mover on the page at 62 days, which matters more to a buyer competing for inventory than the growth rate does. Woodside is ninth at 1.0%.
Jackson Heights is the outlier: down 7.3% over twelve months at $559 per square foot, even as days on market improved sharply from 97 to 76. The landmark-designated pre-war buildings and their generous room sizes are the same as they were in April. The pricing is not.
Brooklyn: A 19-Point Spread Inside One Borough
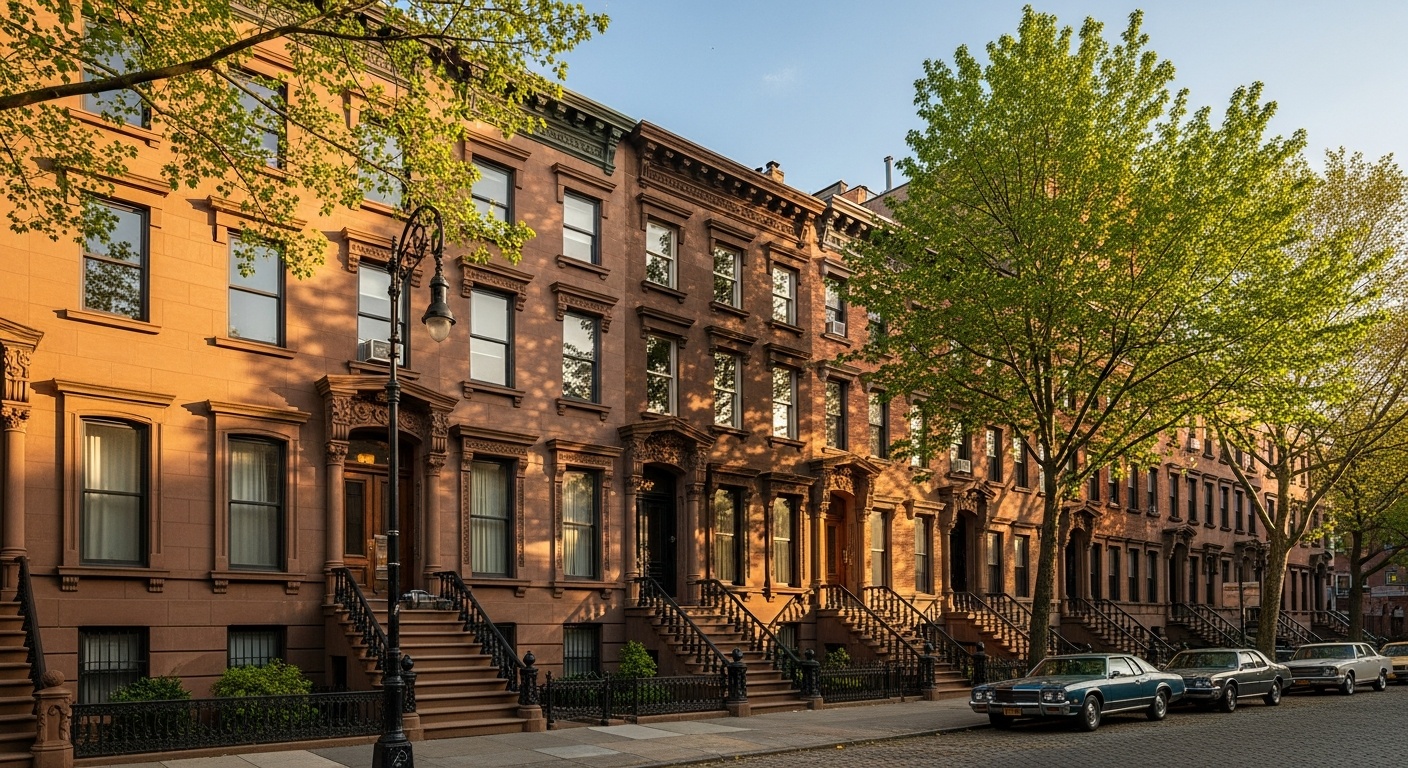
Prospect Lefferts Gardens is third overall at 9.3% growth and $1,033 per square foot across 38 closed sales, adjacent to Prospect Park with B and Q service. Bed-Stuy is eighth at 4.6%, and with 96 closed sales reporting square footage it carries the deepest sample of any neighborhood here; its $847 per square foot is the most reliable single number on this page. Brownstone and limestone rowhouses define the housing stock.
Bay Ridge is thirteenth at 10.0% down and $599 per square foot, with R train access and lower building density. The distance between Prospect Lefferts Gardens and Bay Ridge is 19 percentage points of twelve-month price movement inside one borough, which is the argument against buying off a Brooklyn-wide statistic.
Bronx and Staten Island: Real Prices, Thin Data
Riverdale ranks fifth on price growth at 7.2% and is the slowest-improving market on liquidity, with days on market rising to 102. Its mid-rise co-op buildings offer three-bedroom layouts at a fraction of Manhattan pricing, and Metro-North is the commute. Read my Riverdale guide for the full breakdown. The $519 per square foot figure comes from two sales, so treat it as directional.
Mott Haven and St. George are the two neighborhoods this refresh could not rank. Mott Haven's new condo development along the Harlem River is real and closed at $498 per square foot, but the recorded sales history has gaps that make a twelve-month comparison meaningless. St. George returned one qualifying closed sale in six months and is not covered in the StreetEasy neighborhood series at all. Both stay on the list at their April positions with the gap stated rather than filled with a number I cannot stand behind.
How to Use This Ranking
Price growth is a rear-view mirror. It tells you what the last twelve months did, not what the next twelve will do, and a neighborhood that just ran 12% is not automatically the better buy. Read the three columns together. Growth plus a deep sample plus falling days on market is a market with momentum. Growth on a sample of two is a rounding error wearing a percentage sign.
For investors, pair the growth column with rental yield, which this ranking does not measure. For owner-occupants, commute time, building financials, and the alteration rules in the co-op renovation guide will shape your experience of the apartment far more than a percentage point of appreciation. Anyone buying in the next few months should also read the NYC closing process timeline before making an offer.
Every neighborhood above links to a full market report with live listing data.
Want These Numbers Run for Your Budget?
Milton Coste, Licensed Real Estate Associate Broker at Keller Williams NYC, pulls neighborhood-level RLS data across all five boroughs. Tell me your price range and how long you plan to hold, and I will run the comparison for the neighborhoods that actually fit.
Schedule a Free Consultation
Get NYC market insights delivered to your inbox
New listings, market data, and expert analysis. No spam.
We respect your privacy. Unsubscribe at any time.