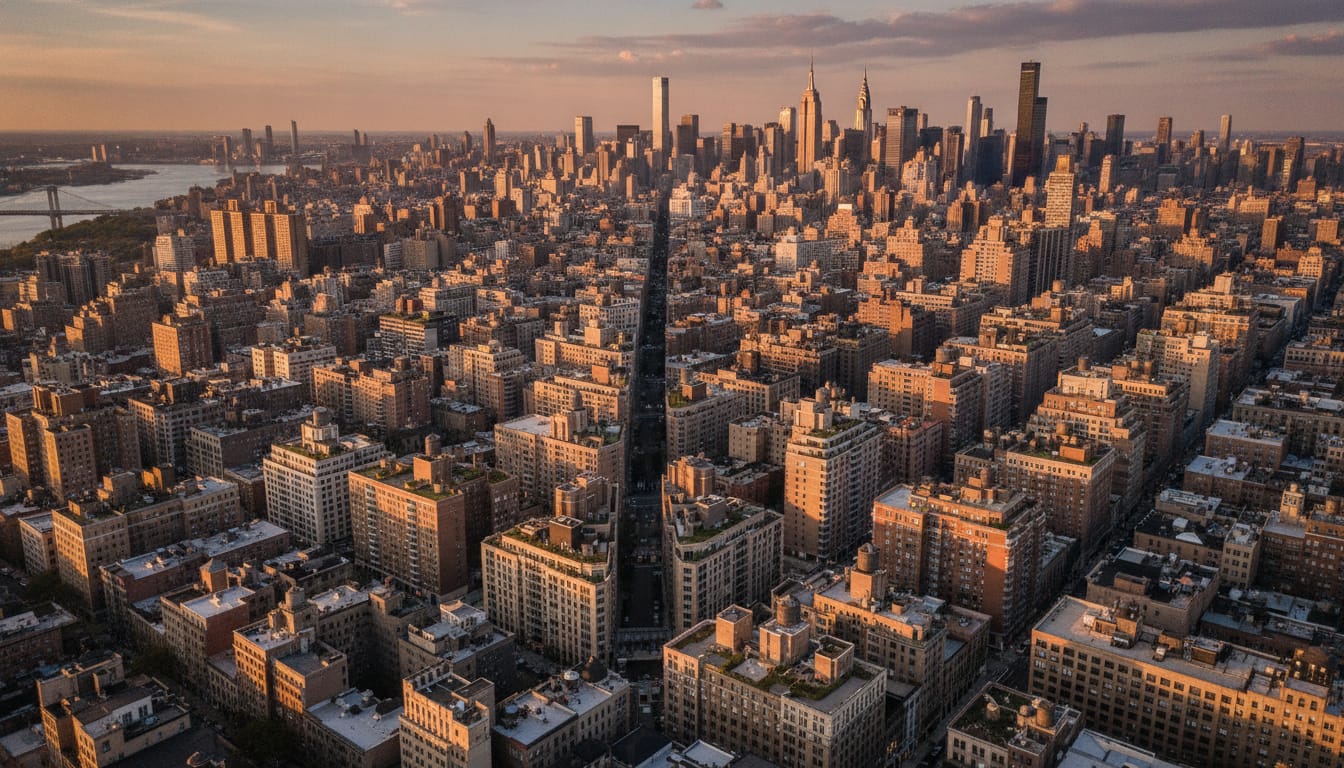
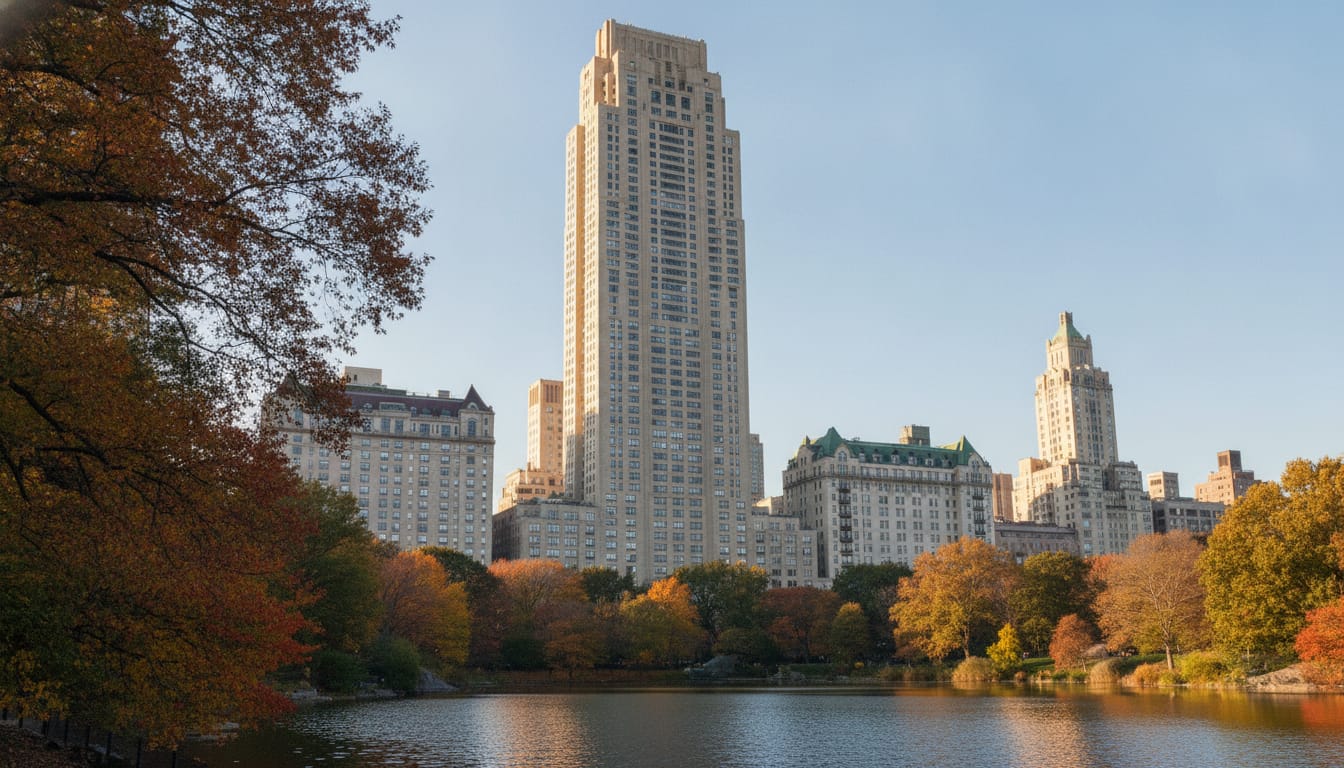
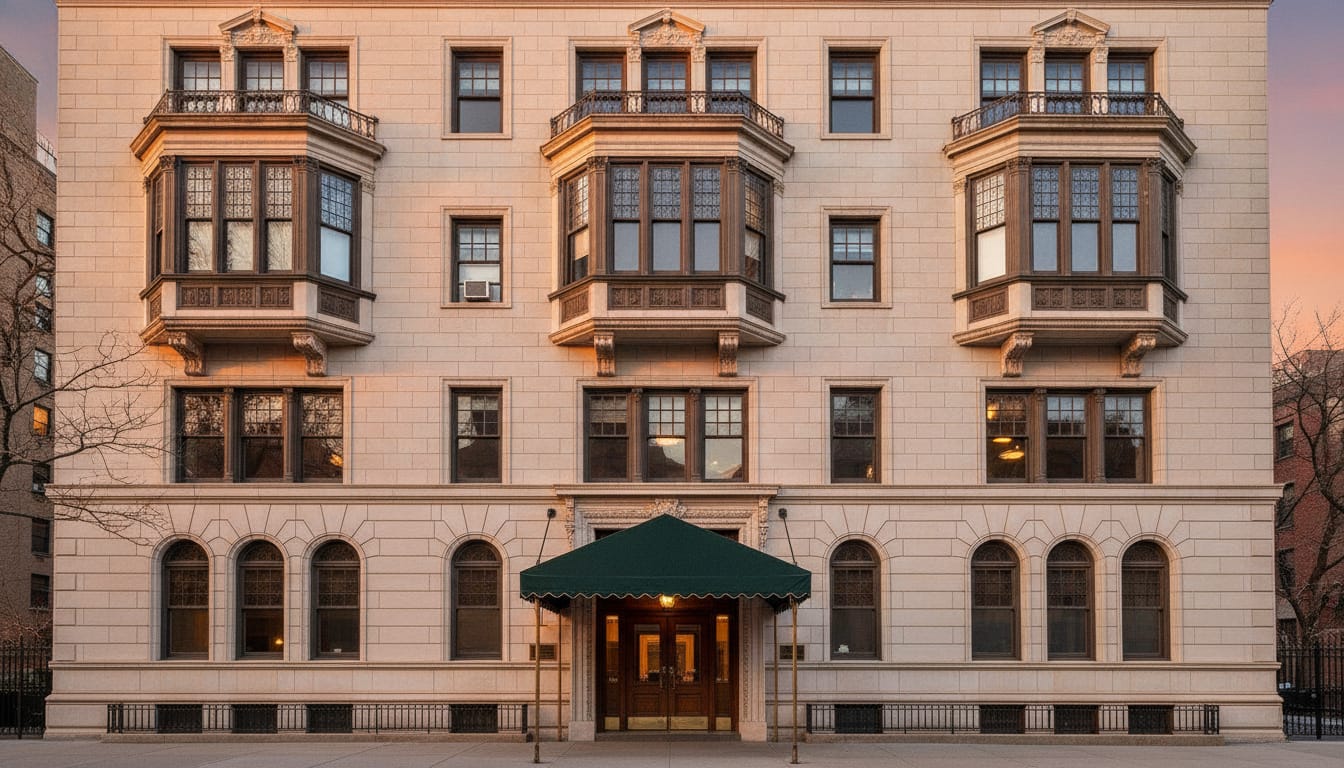
Manhattan Neighborhoods With the Most Pied-a-Terre Tax Exposure
Ten Manhattan neighborhoods hold $1.02 billion of the $1.67 billion in annual Phase 1 exposure on the Department of Finance roll.
Milton Coste, Licensed Real Estate Associate Broker•Keller Williams NYC•NY Lic. #10301213304
October 9, 2026• 5 min read•25+ Years Experience
Facts checked October 9, 2026. Roll data: Department of Finance supplemental roll of July 24, 2026. Neighborhoods are the areas this site assigns each building to.
Lenox Hill leads the Department of Finance roll with 1,767 condo and co-op units valued at $1,000,000 or more and $157.6 million a year in Phase 1 pied-a-terre exposure, and the top 10 Manhattan neighborhoods together account for $1.02 billion, about 61% of the $1.67 billion citywide. Manhattan holds 16,999 of the 17,750 over-the-line units and 94% of the dollars. Brooklyn has 694 units ($65.9 million), Queens 44 ($28.1 million), the Bronx 12 ($6.2 million) and Staten Island 1 ($68,167).
I run the surcharge math on every second-home purchase I price, and the roll helps me answer a buyer's first question about a building: how many of the apartments around it carry this cost. Exposure here is the maximum, assuming every unit over the line were taxed. Many are primary residences and exempt, so read these as where the cost question is largest, not where bills will be largest.
Each neighborhood name links to the building-by-building roll for that area, and the last column links to its market report for sales data. The ten together hold 11,079 over-the-line units.
What the numbers show
Rank by exposure and rank by unit count are not the same list. Lincoln Square is second on exposure with fewer over-the-line units than Lenox Hill (1,331 against 1,767) and its exposure per over-the-line unit averages about $113,321 against about $89,170. NoHo and Union Square average $140,858 and $131,765 per unit, the highest on the list.
The share of units over the line varies more than the dollars do. In SoHo, 44% of the lots on the roll (1,337 of 3,024) are over $1,000,000. In Tribeca it is 21%, in Lenox Hill 14%, and in the Upper West Side 7% (568 of 8,704). The Upper West Side makes the list on size: most of its lots stay under the line.
How to read "median value of units over the line"
It is the middle valuation among the units in that area that are at or above $1,000,000. A median of $1,347,634 in Lenox Hill means half of its over-the-line units are valued below that figure, which places at least half of them in the 4% band.
See the buildings behind these numbers
Enter an address and I will show the Department of Finance valuation, the rate band, and how the building ranks inside its neighborhood.
If the apartment you are pricing sits in a neighborhood with a high share of over-the-line units, expect buyer's counsel to ask about the valuation and residency.
A neighborhood's exposure total says nothing about one apartment. Your unit's valuation on the bill and its status as a primary residence decide your cost. The first-year cost of a $3,000,000 second home shows how to add it up.
Valuations near $1,000,000 matter most where many units cluster just above the line; see the $1,000,000 cliff.
Outside Manhattan the picture thins out fast. Boerum Hill, in Brooklyn, is the highest-ranked neighborhood outside Manhattan on the roll, with 67 over-the-line units and $15,820,678 a year in exposure, which would place it behind the top 10 by a wide margin. Brooklyn as a whole has 694 units over the line and $65,887,436 in exposure, against $1,565,735,055 for Manhattan. You can read the Boerum Hill roll and its market report the same way as the ten above.
The pied-a-terre tax hub has the full list of neighborhoods and buildings, and the open data downloads behind these figures. I describe buildings and values here and nothing about the people in them.
This is general information, not legal or tax advice. Confirm your own filing with a New York real estate attorney or your CPA.
NYC Condos $1M and Up
Manhattan and Brooklyn condos in the price range the surcharge reaches
Facts on this page were checked against these sources on October 9, 2026.
NYC Department of Finance, Supplemental Market Value Roll, tax year 2027, published July 24, 2026, analyzed by miltoncoste.com, neighborhood and borough totals
Send the address you are looking at. The report covers what the listing leaves out: the recorded sale history, the tax and abatement picture, open building violations and permits, and the closed sales that set the price. Milton prepares it from public records. Free, no obligation.